What can the numbers tell you about whether your transition is real, and what can they not tell you?
Choose evidence that helps your team judge whether the work is improving, whether people are developing, and whether leadership is keeping its commitments. This section offers candidate measures and explains the limits of each.
The candidate instruments in this section follow from the loops in Section 7.1 and the iceberg in Section 7.2. They are a practitioner measurement design, still unvalidated as a diagnostic scale. Without a causal frame, measurement becomes a list of KPIs detached from the system it is meant to describe. With one, measurement can become more useful: evidence about which direction a hypothesized loop may be running and where an intervention may be landing. The numbers do not establish the loop by themselves.
Why the Default Dashboard Fails
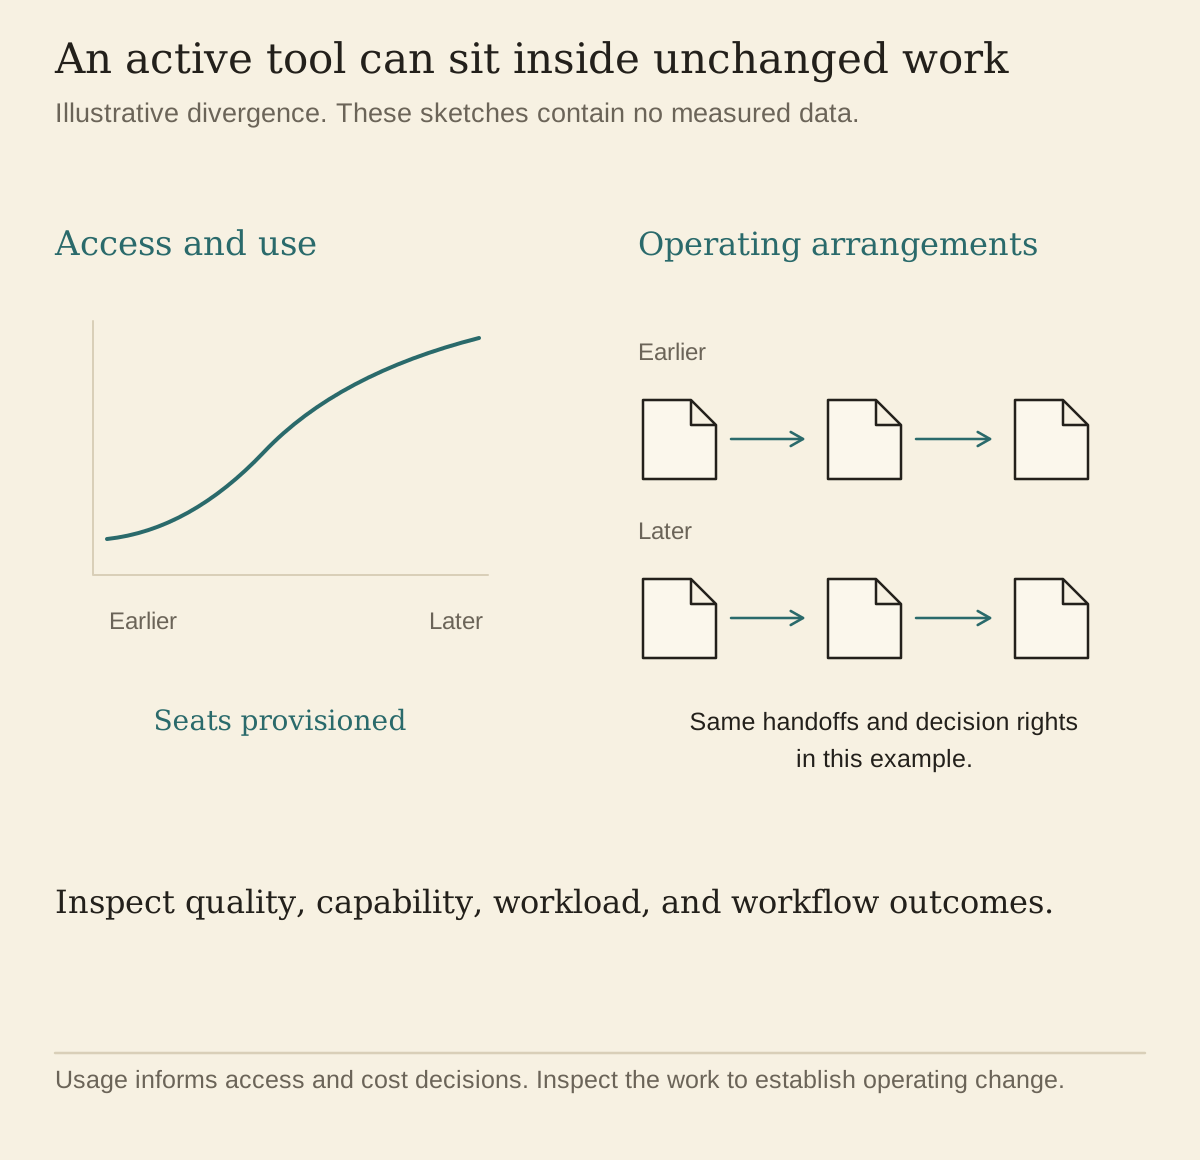
A common AI dashboard measures adoption. Seats provisioned. Weekly active users. Prompts per user. Percentage of employees who have used the tool this month. Departments ranked by usage. The dashboard is easy to build and report, and its lines often rise during a rollout.
The dashboard measures activity. It can answer useful operational questions about access, support, and cost, but it cannot tell you whether the work improved or which direction the loops from Section 7.1 are running. Used as a target, it can reward exactly the behavior this book cautions leaders to avoid. A worker who routes every task through a model and ships the first answer can score above a colleague who uses AI selectively, verifies the result, and protects a capability that still matters. Adoption is an input signal. The outcome comes later.
This is the Goodhart problem, and it deserves to be named plainly. Once a measure becomes a target, optimization pressure can degrade its relationship to the thing it represented. Adoption metrics may be useful evidence that access and use are changing. They are weak evidence that a company is becoming AI-Native, and weaker still once pay, status, or quotas depend on them. They can certify that the chat window is open. They cannot certify that judgment improved.
Section 7.1 named the metric-displacement loop as one of the defeating loops: values translated into metrics, metrics driving behavior the values never intended, more metrics added in response. The honest reader will notice a tension. That loop warned against exactly the exercise this section performs. The response is not a magical set of better metrics. It is a measurement practice: use several forms of evidence, state what each signal cannot show, protect privacy, avoid individual quotas, look for disparate effects, and revisit the causal model when the evidence does not fit. The candidate signals below cover only part of what matters.
Goodhart's law. The observation that a measure degrades when it becomes a target originates with the economist Charles Goodhart, writing about monetary policy in 1975. The formulation most people quote, "when a measure becomes a target, it ceases to be a good measure," was coined by the anthropologist Marilyn Strathern in a 1997 paper on university audit culture. Both versions describe the same failure: the proxy gets optimized, the underlying value does not.
Goodhart, C. A. E. (1975). "Problems of Monetary Management: The U.K. Experience." Papers in Monetary Economics, Vol. I. Reserve Bank of Australia. / Strathern, Marilyn (1997). "'Improving Ratings': Audit in the British University System." European Review, 5(3), 305-321.
Measure the Loops, Not the Events
One useful account of the transition is the state of the loops. The leadership team's instrument panel should therefore ask: what evidence would we expect if this loop were running in either direction, and what other explanation could produce the same signal? Here are candidate signals a leadership team can adapt and test. Keep the panel small enough to use. It should read the system and leave individuals unranked, and access to underlying data should follow purpose, consent, and need.
The knowledge-capture loop.
Capture and reuse. Contributions to the governed knowledge base per team per month and, more telling, how often approved knowledge gets drawn on in subsequent work. Separate useful reuse from repeated retrieval of stale or incorrect material. A graph, repository, or library that is written to but never read from may be a compliance exercise wearing an architecture costume.
Coverage and freshness. Of the processes in your operating system inventory (Section 3.2), what share have current knowledge behind them, and how stale is the rest? A coverage map with dates on it is one of the most clarifying artifacts a leadership team can commission.
Breadth of contribution. How many distinct teams contributed this quarter? A loop fed by the same three enthusiasts every quarter has not started compounding, however impressive their output looks.
The trust loop.
Commitments made versus commitments kept. The covenant from Section 5.2 generates promises. Track them, visibly, the way you would track any other obligation. The workforce is already keeping this ledger informally. Keeping it formally tells them you know that.
Who can participate safely. At an aggregated level, are people across roles, tenure, locations, and levels able to contribute voluntarily, or is participation concentrated among people with unusual security, access, or spare time? Do not interpret nonparticipation as disloyalty or expose small groups through the data. Participation is one indirect signal of the conditions around trust.
The candor pulse. Ask, directly and regularly, whether leadership's account of the transition matches what people see on the ground. Protect anonymity where it can genuinely be protected, state who will see the data, report only groups large enough to avoid reidentification, and pair the trend with listening and action. A pulse can reveal a gap; it cannot explain the gap alone.
The practice-and-craft loop.
Practice review. Are the practices from Section 6.1 actually happening? A standing review, qualitative is fine, of what is being practiced, what is getting skipped, and what is in the way. Section 6.1 already made this a condition; here it becomes an instrument.
Shared-asset vitality. Contribution and reuse rates on the collaboration surface: prompt libraries, shared work products, team playbooks. A vital surface shows both creation and reuse. A dead one shows neither, whatever the login numbers say.
Work quality over time. With appropriate access and a stable rubric, sample comparable work products and ask whether they are improving in ways the team and its customers can name. Review aggregate patterns and calibration, and never build a covert employee ranking from them. Movement may be evidence of the craft loop compounding; changes in task mix, staffing, or customer demand are competing explanations to examine.
The up-leveling loop.
Supported-stretch share. What fraction of the workforce has a development opportunity near the edge of its current capability, chosen with the person and paired with time, support, and feedback? Aggregate the answer and audit whether opportunity is distributed fairly. A manager who cannot discuss development may need support; the absence of an instant number is not proof the manager does not know the team.
Protected time honored. At a team level, compare protected learning or deep-work time promised with time actually available, using the least intrusive data that answers the question. Calendars can help, but they also contain private information and do not reveal the quality of attention. Ask people whether the protection worked.
Active mentorship. Measure whether voluntary mentoring relationships receive time and support and whether participants find them useful. A meeting count alone can turn mentorship into attendance theater.
The resisting and defeating structures. These do not all have a single needle that should be low. Look for the mechanism, the protective function, the harmful side effect, and the direction of change.
Shadow-to-official estimate. Using privacy-preserving security and survey evidence, estimate how much AI use occurs through approved tools and how much does not (Section 4.3). Falling shadow use can mean the approved path is better, a prohibition is working, use has moved elsewhere, or people have become less candid. Investigate before assigning meaning.
Decision time for experiments. Track how long comparable proposals spend in review, including time waiting on the proposer and time required for legitimate risk work. Rising unexplained latency may indicate an overbroad approval process. Falling latency without adequate review may indicate the opposite failure. The aim is proportionate governance, even when it slows the path to yes.
Contribution change. At a sufficiently aggregated level, notice teams that used to contribute approved knowledge or practice notes and have stopped. This may be an early signal of cynicism, or it may reflect workload, completed work, changed relevance, privacy concern, or a better channel. Use the signal to ask questions, and leave diagnosis to the conversation that follows.
The Four Altitudes of Measurement
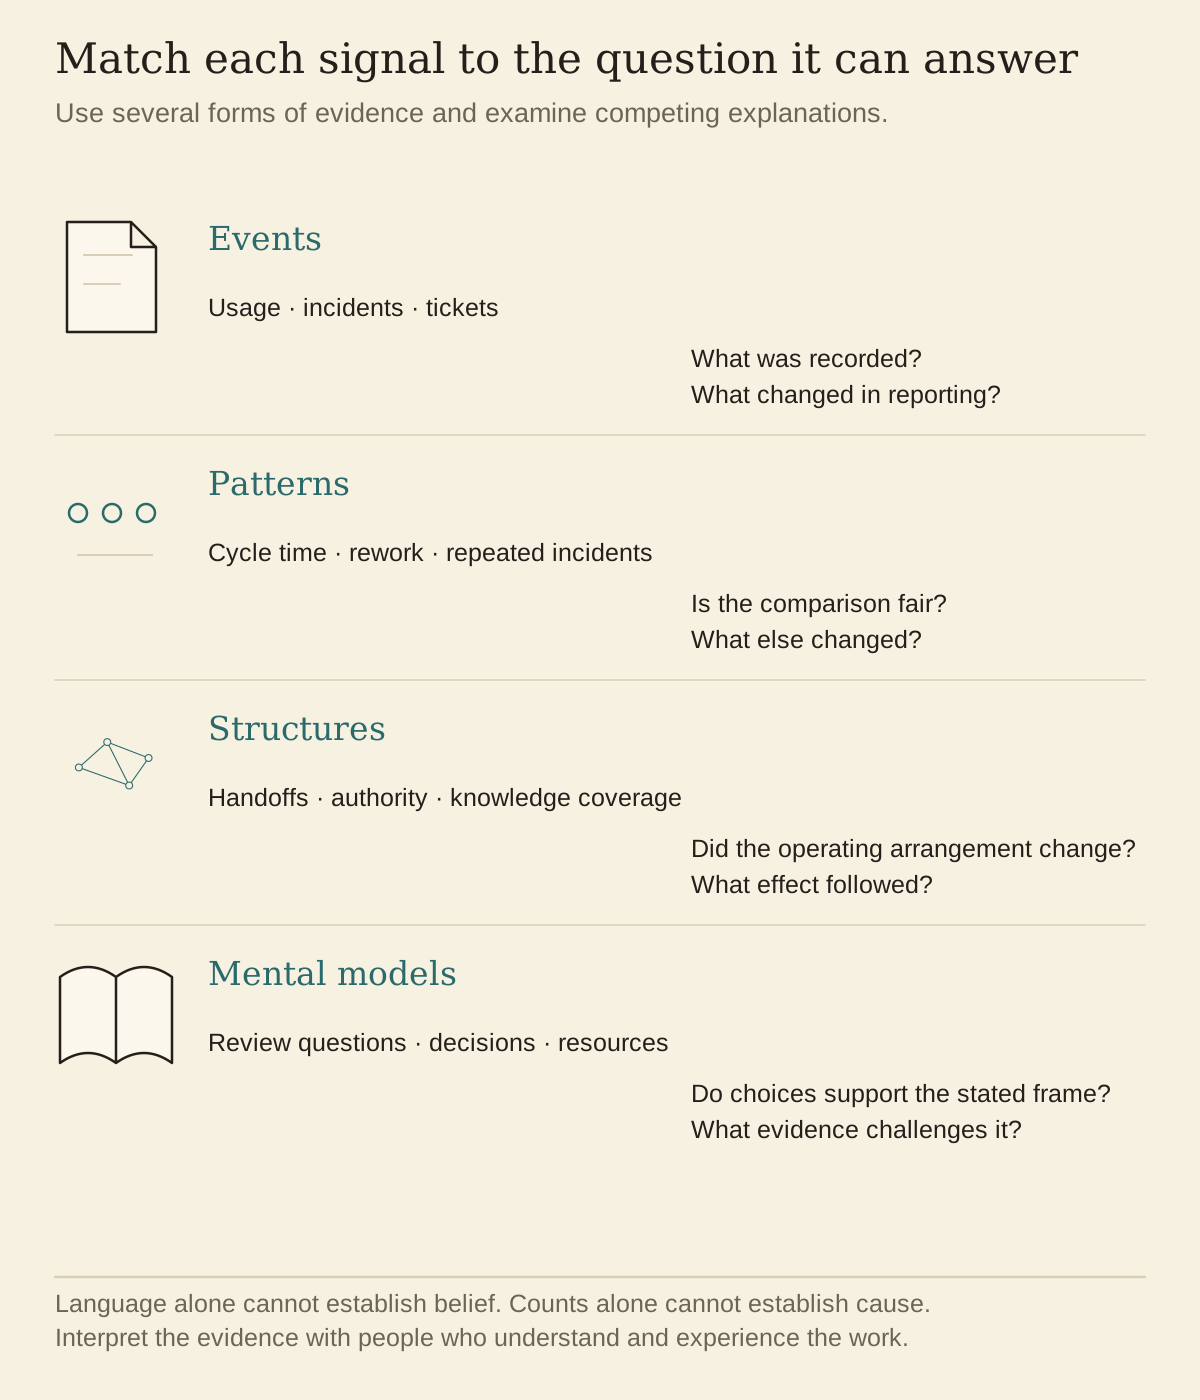
The loop panel offers evidence about direction. The iceberg from Section 7.2 offers a way to classify that evidence. Measurements can point toward each of its four levels, and many dashboards concentrate above the waterline because events and patterns are easier to count.
Event metrics. Usage counts, incident counts, tickets, cycle counts. Often inexpensive and operationally necessary. They tell you what was recorded as happening, and the reasons have to be found elsewhere; combined with context and a causal model, they may still help anticipate what comes next.
Pattern metrics. Workflow cycle times. Rework rates. Repeat-incident rates. Quarter-over-quarter trends in capture and reuse. Patterns are where diagnosis starts, because a pattern establishes that the event was not a one-off.
Structure metrics. How many workflows have been redesigned around a demonstrated need rather than merely supplemented with a tool? What changed in decision rights, handoffs, controls, workload, and outcomes? What is the coverage and freshness of the relevant governed knowledge, whatever its storage form? Has performance management been revised where old incentives conflict with the new work? Does governance enable bounded learning while enforcing stronger controls as consequence rises? A count without these distinctions rewards relabeling.
Mental-model signals. This layer resists dashboards. Observation can still reach it. Listen to what the leadership team asks about in reviews, but do not mistake language for belief. Questions about cost, speed, and headcount may be necessary; the problem is when they crowd out quality, workforce effects, rights, knowledge, risk, and customer outcomes. I ask teams to keep a record of the questions asked in a quarterly review and sort them by altitude. Then I compare the questions with decisions and resource flows. A new vocabulary is weak evidence. A repeated change in choices when the old incentive still pulls the other way is stronger.
The Workforce Trajectory
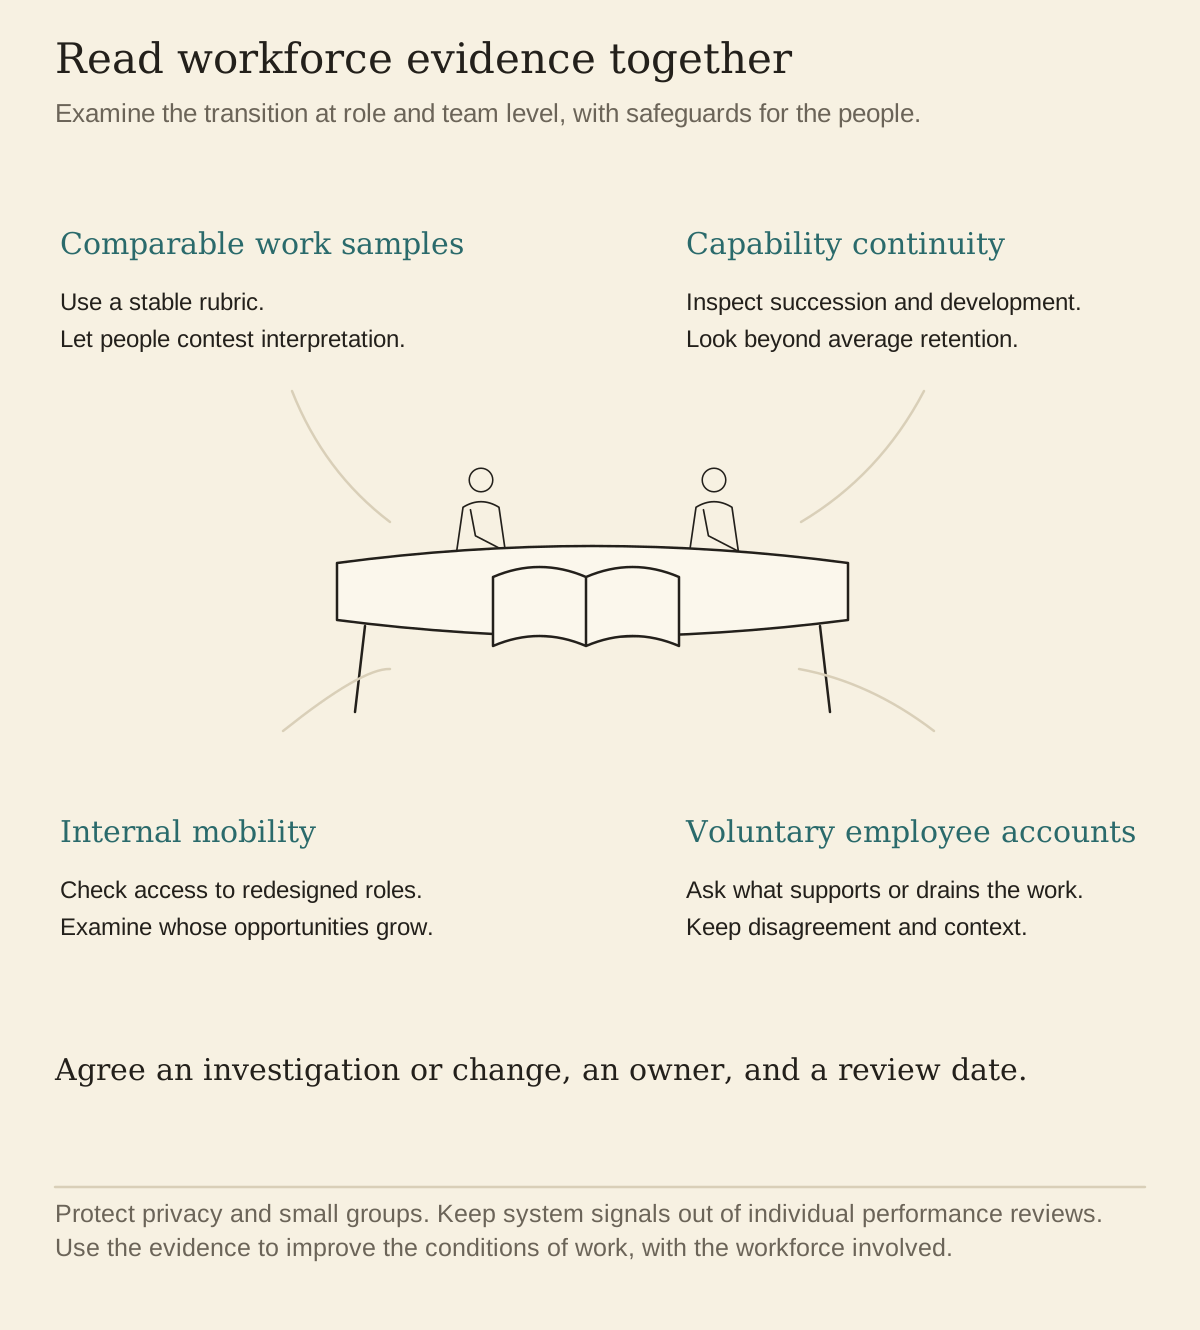
Section 5.6 posed the questions: are workers developing or losing capabilities the role still requires, engaging or disengaging, gaining agency or losing it? Those questions can be investigated, though no single instrument settles them. Here is how I have seen teams begin.
The work-sample comparison. With employee participation, appropriate permissions, a stable rubric, and comparable tasks, examine how the work of a role or team changes over time. Is it using more judgment and synthesis, developing new capability, or narrowing toward checking machine output? Review aggregate patterns and let people contest the interpretation. Do not repurpose ordinary work as a hidden performance test. This practice is home-grown; I know of no validated methodology for the longitudinal assessment proposed here, and a small sample should generate questions rather than conclusions.
Retention of critical capability. Overall attrition can hide what matters. Track where scarce judgment, relationships, and operating knowledge are concentrated, whether succession and development exist, and whether regrettable departures cluster by role or team. Avoid a secret list of supposedly indispensable people: it can reproduce bias, create surveillance, and confuse current visibility with actual contribution. Section 7.2's senior analyst walked out of a company whose average retention number could still look fine. Measure capability risk and bench strength alongside attrition.
Internal mobility into AI-fluent roles. Are people moving through the transition into redesigned roles, or does every AI-fluent position get filled from outside? Outside hiring can add capabilities the company does not yet possess. If it becomes the only pathway while internal candidates receive training but no opportunity, that is evidence the up-leveling loop may not be reaching the workforce, whatever the completion numbers claim.
The welder's-standard pulse. Ask them. A voluntary rotating sample, a real conversation, one question at its center: is this work challenging you in ways you value, or draining you? Bring themes and carefully deidentified excerpts to the leadership team, along with disagreement and context; never promise anonymity that a small sample cannot provide. The welder's standard from Section 5.6 was framed as a question a leader should be willing to be asked. This is the practice of asking it early, while the work can still be changed.
Measurement Theater
The failure modes of transition measurement are as patterned as the loops themselves. Five recur.
Dashboards that never inform a decision. The test is one question: name the last decision, investigation, or obligation this dashboard supported. If the room goes quiet, the dashboard may be theater, or its purpose needs to be stated again. Either way, its maintenance cost is being paid in credibility as well as hours. Somebody still updates it every Monday.
Metrics that punish honesty. Reported AI incidents rising early in an epistemic-hygiene program can be evidence that people are catching and surfacing what was previously invisible. It can also mean exposure or actual harm increased, so reporting volume must be read beside usage, severity, detection method, and outcomes. A team told only that its incident count must go down may stop reporting incidents long before it stops having them. Decide in advance which signals may rise as visibility improves, and investigate rather than punish the rise.
Short-cycle demands on long-cycle change. Up-leveling and trust may take years to compound, even though early harm, broken commitments, and unequal effects require prompt attention. Demand a predetermined quarterly improvement and you invite fabricated movement or abandoned investment. My working rhythm is a starting hypothesis for each team to adjust: inspect leading signals and harms frequently, review meaningful outcomes when the work could reasonably have changed them, and set longer decision horizons in advance with checkpoints and stop conditions.
Measuring people when you meant to measure loops. The moment a capture-contribution signal becomes an individual quota, you have armed the defensive-expertise loop and taught the workforce to game the graph. Every signal on this panel reads the health of a loop. None of them belongs in a performance review.
The complete-coverage fantasy. Section 7.1 said the companies that escape metric displacement are willing to operate without complete metric coverage, and this section does not repeal that. Some of what you most value will resist direct measurement. Use careful qualitative evidence and invest in the practices and moments that may produce it. Let the panel acknowledge uncertainty rather than installing a bad proxy and optimizing it into something you did not want.
Bring this into the room. The instrument-panel exercise. Each member of the leadership team writes down, alone and before discussion, three pieces of evidence they would want to see regularly to judge whether the transition is real. Put them on the wall. Sort them against the four altitudes, then mark the population, data source, privacy risk, competing explanation, expected time horizon, and decision each could inform. In my experience the wall begins crowded at the event level and thins with depth. Then build the shared panel: a small set of signals and qualitative evidence, the major loops represented, more than one altitude represented, and each item owned by someone who will be asked what was learned or decided from it.
One more thing before leaving the systems view. A panel like this can make the transition feel like something you watch, and the transition remains something you run. The instruments exist so that the four-question loop diagnostic from Section 7.1 gets answered with evidence instead of impressions, and so that the interventions from Section 7.2 get aimed below the waterline. The reading is in service of the intervening.
The numbers and qualitative evidence help you judge which way the loops may be running. They do not tell you what the transition feels like from inside a working day. That is what Stage 8 is for: a Tuesday morning in a company where the loops appear to be running in the right direction, and honest stories from companies where they were not.
Consider. If you keep three things from Stage 7: 1) Map what is reinforcing change and what goals, constraints, delays, or side effects are counteracting it. 2) Run the four-question loop diagnostic on a cadence, together, with honest specificity. 3) Use evidence to read the system without turning system signals into covert individual performance measures, or you may arm the loops you are trying to understand.